Dear Client:
The first three months of 2016 came in like a lion and went out like a lamb, with the S&P 500 Index falling 10.5% on a closing basis, and rallying back to a slight gain on March 31. While we have discussed stock market volatility in recent letters, we felt it would be useful to recap the latest episode.
Sources of Volatility
A Less Accommodative Fed
Volatility rose in 2015 following the cessation of quantitative easing by the Federal Reserve in October 2014, exemplified by 71 trading sessions of index price moves greater than 1% versus only 38 days in 2014. The Fed followed up with its first Fed Funds rate hike in this past December since June 2006. In short, the Fed has transitioned from an “easy money” accommodative policy, which tends to support asset prices through excess liquidity, to a more neutral stance. Given this backdrop, price/earnings multiples cease to rise and the markets become more sensitive to news events and perceived risks.
We maintain our position stated in our January letter that we would not expect more than one Fed rate-hike in 2016, although the Fed members were indicating four rate increases during this year. During depths of fear in early February, there was a notion that the Fed would reverse course and perhaps follow Japan to a policy of negative interest rates in the case of dire circumstances. The yield curve flattened significantly reflecting recessionary conditions. The yield on the 10 year U.S. Treasury dropped below 1.8% as investors sought a safe haven, while yields in non-investment grade bonds spiked higher based on default risk. U.S. and European banks were among the worst performers from the combination of a flatter yield curve, which negatively impacts their spread on loans, and the elevated risk of default by borrowers, particularly energy companies.
Fear of Potential Global Recession
There is risk of a global recession as the Chinese economy slows. The World Bank estimates global GDP will grow by 2.9% in 2016 while the IMF forecasts 3.2%. Both were reduced from prior estimates. The Shanghai Composite dropped over 22% in January even though the IMF expects China to grow by 6.5% in 2016. As China manages its economy to a slower pace, it is having a major impact on raw-material producing countries. China consumes roughly 40% of the world’s industrial metals and 70% of coal. The reduced development for infrastructure and industrial capacity has caused a collapse in many commodities: copper for example, has declined more than 50% since January 2011.
Although China is an important export market for some countries/industries, it is less so for the U.S. China accounts for 7% of U.S. exports, representing less than 1% of U.S. GDP and less than 2% of revenue of the S&P 500 companies. U.S. industries that are most impacted are transportation equipment, agricultural commodities and technology components. The Chinese consumer represents 40% of its economy, and consumer spending is growing at a 10% annual rate. While China is experiencing currency pressure, its economy continues to grow at a faster rate than the U.S., and the adjustments taking place in its economy have a muted effect on the U.S. economy.
Fear of weakness spreading throughout the global economy with Russia and much of South America in deep economic and currency declines, and Japan embracing negative interest rates also contribute to the volatilities. As for the U.S., the Fed reduced its 2016 GDP outlook in December to 2.2%, partially based on the aforementioned reduction in capital expenditures in both energy and machinery. The Institute of Supply Managers (ISM) Index is a leading economic indicator, and it posted five consecutive months of contraction through February. In addition, domestic manufacturing jobs shrank 18,000 in February and 29,000 in March. The latest data on GDP is the December quarter grew at a 1.4% annual rate, which is better than the earlier estimate of 1%. The downside is that the Atlanta Fed model is predicting only 0.1% growth in the March quarter.
Oil
Crude oil is substantially below its peak in 2008 and its price of $100 per barrel less than 24 months ago. WTI crude traded as low as $26.05 before recovering to $38.34 at quarter-end. While global demand for crude is holding steady at 95 million barrels-per-day, daily production is 1.7 million barrels higher than demand. In spite of drastic cuts to domestic energy companies’ capital spending budgets in 2015 and 2016, production has only fallen slightly thus far due to higher productivity. The lower oil prices have raised fears of industry-wide bankruptcies and the domino effect of higher loan-losses for the banks.
Reduced U.S. Earnings
The drop in earnings is another concern as S&P 500 operating income in 2015 fell for the first time since 2008. As of December, the S&P 500 Index 2015 earnings-per-share was forecast to fall in a range of $117.60-$118.70. Following disappointments during the January-February reporting season, S&P operating earnings are indicated at $110.54, representing a 2% decline from last year, with much of the shortfall coming from the Energy, Industrial and Financial sectors.
Earnings in 2015 were significantly diminished by lower oil prices, and the resultant decline on oil-patch machinery orders, along with the strength of the trade-weighted dollar adversely impacting currency translation of multi-national reported revenue. Both of these forces, acting as headwinds, have stabilized for now so we anticipate easier comparisons beginning in the June quarter and look for positive earnings growth in 2016. As for our core holdings, the results of the fourth quarter of 2015 turned out to be mostly better or in-line with market expectation. About 57% of them have reported stronger or in-line revenue numbers as many of our global companies felt the headwinds from a strong U.S. dollar to their exports. Even better, 82% of them have reported earnings per shares numbers equal to or higher than expectations.
Money Flow
Net flows out of mutual funds have served to magnify recent weakness with investors opting to hold cash reserves or treasury bonds. This situation was exacerbated during market lows in February as many corporations could not exercise stock buyback plans during their “quiet period” around earnings announcements. It was a classic case of a “buyers strike,” and was a temporary event not based on investment fundamentals that led the Russell 1000 Large-Cap Index to a price decline of almost 12% in the quarter on an intraday basis.
Why We Remain Confident about the U.S. Economy
Over 90% of U.S. GDP comes from consumption, services, housing and government spending, with each of these components expected to grow in 2016. Personal consumption and personal income have been growing in a range of 2.2-2.4% the past two years, and the latest core Consumer Price Index report rose 2.3% through February. Apart from weakness in gasoline and natural gas prices in the last year, which benefits the consumer-at-large, there is little deflation in U.S. prices. Oil appears to have stabilized in the mid-upper $30s price for now, although potential supply shocks from turmoil in the Mideast could cause volatile swings in the future.
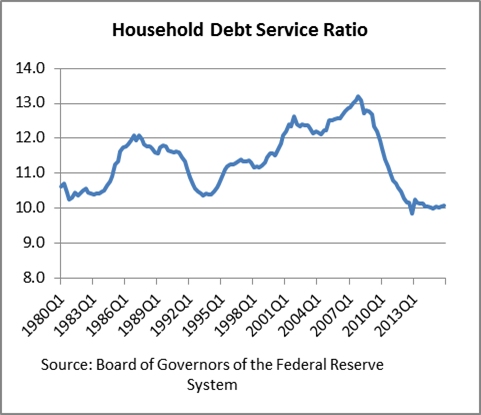
The balance sheet of consumers is in good shape, partially assisted by lower energy prices. Thanks to rising prices of financial assets and homes, household net worth is reaching all-time highs (see Chart 1). At the peak in 2012, 31% of all mortgages on single-family homes were in negative equity, where the value of the house is less than the outstanding mortgage debt balance. Today, this number is reduced by more than half to 13%. Historically low interest rates have allowed consumers to deleverage, as indicated by the lowest household debt service ratio since available data beginning in 1980 (see Chart 2). Jamie Dimon, chief executive officer of the bank JP Morgan Chase, commented recently that the consumer balance sheet has almost never been in better shape and a proprietary study of the bank revealed that U.S. households are spending the majority of savings from lower gasoline prices (around $0.80 of every $1.00 saved). The sentiment at a recent consumer staples industry conference we attended was similar: CEOs of multinationals such as Procter & Gamble and Colgate-Palmolive are seeing sales growth issues in emerging markets, especially in Brazil, while the outlook for their US business remains positive.
Chart 1

Chart 2
With 7% of the U.S. workforce employed in manufacturing, we do not anticipate an export-led slowdown to tip the U.S. into recession. Rather, we expect the domestic economy to continue at a slow pace of growth. The ISM index turned positive in March with a reading of 51.8. The Fed’s outlook for GDP is 2.2% in 2016, whereas some private economists are modeling 2% growth. In her comments to the Economics Club of New York on March 29, Fed Chairwoman Yellen reiterated the necessity of the Fed to slow the path of interest rate increases based on tenuous economic and financial market conditions in other parts of the world. The risk is not that a slowing economy in China or other export countries will cause a recession in the U.S. Rather, higher rates in the U.S. could further slow a slow-growth U.S. economy, which would very likely tip our trading partners into recession. These comments further helped the stock market repair the damage sustained in February as prices rose on the realization the Fed would be “lower for longer” with its rate policy.
Our Management Philosophy during Volatile Periods
Our process to control portfolio risk includes rebalancing and reducing stock positions that have grown to be larger percentage sizes over time when prices are relatively high, and initiate or add to undervalued positions if the opportunity arises during market corrections. In this quarter, the largest decliners were emerging market stocks, smaller energy companies and banks. We are underweight in all of these sectors. Healthcare was also among the losers, although that appears to be more the result of political rhetoric during election season, instead of fundamentals. We recognize that stock selection is more critical now that the Fed is no longer pumping excess liquidity into the economy, which had the effect of a “rising tide lifting all boats.” We continue our discipline of buying companies with attractive fundamentals at a reasonable price.
The fears and concerns that lead to market corrections and volatility are transitory. In the summer of 2014, it was the risk of a Greek default; last August and in February it was deflation/recession risk. Invariably, there will be another topic of concern, and we note the U.S. presidential race will be at the forefront this summer and into autumn. We do not know the depth or extent of corrections ahead of time, or when they will begin, but we know it is a normal part of the investing cycle so they should not come as a shock. For anyone with a minimum five-year investment horizon, stocks represent an attractive allocation of a liquid portfolio. The pattern of stock returns is one of short-term gains and losses around a long-term trend of higher prices. During periods of market dislocation, it is important to remember our long-term objectives as they relate to our investing goals and spending needs.
Please contact us to discuss your personal investment expectations and needs.
Sincerely,
Research Team
Form ADV is available upon request