Dear Client,
Mid-Year Review
For the first six months of 2016, the S&P 500 Index has traded in a 310 point range from -11.4% to +3.7% before finishing with a price gain of 2.89%. The rebound in US stocks staged in late February and March carried through until mid-April, when weak earnings results coupled with a potential Fed rate hike during the summer began to weigh on equity prices. S&P 500 operating earnings fell 4.7% during the first quarter reporting period led by weakness in retail sales and energy companies. In spite of this, there was enough positive underlying economic data for the Fed to telegraph their intent to consider another increase in the Fed Funds rate during their scheduled summer meetings. The weakness in the May jobs results quickly altered market expectations of a summer Fed hike, which in turn led to a brief equity rally.
As the referendum on the British vote to exit the European Union, termed “Brexit” by the media, came into focus, market volatility came into play. The CBOE Volatility Index (VIX) ranged from a low of 12.77 on June 7 to high of 26.62 on June 27 following the surprise tally of votes to exit the EU after 43 years. Because of the uncertainty now surrounding European and global economic growth, some pundits are calling for the next Fed move to be a reduction instead of an increase in the key lending rate. Global bond yields fell on the news, with Japan’s 30 year sovereign bond trading as low as 0.11%. Over two trading days immediately following the vote, world equity markets declined $3 trillion and the S&P fell by $2 trillion, with financial stocks bearing the brunt of the selling. By the end of the quarter, the S&P had recovered 99.3% of the “Brexit” related selloff, thus in the short term the event looks to be less of a drastic event to the US equity markets than previously feared.
The uncertainty, however, will remain. A look at the political turmoil in the days after the referendum suggests that none of the British politicians had a plan B for an actual “leave” vote. Uncertainty affects investments and consumption, and might firstly impact the UK economy negatively, secondly the trade with and economic growth of the European Union (EU), and indirectly the rest of the global economy. At the moment all kinds of scenarios seem possible: From tough, multiple-year negotiations between the UK and EU which will result in some special status for Britain, to a reversal of the decision as voters start to feel the economic consequences. At best, the Brexit might resemble Greek’s debt crisis with periodic negative headline news and short-term market volatility, but with the difference being the Brexit issue will be resolved in the long-run.
Negative Interest Rate Environment
Another area of concern making headlines and impacting the markets is continually falling interest rates.
Amount: $11.7 trillion worth of government bonds currently have negative nominal yields, which is around 40% of the outstanding debt of developed countries. Central banks of Europe, Switzerland, Sweden, and Japan set negative short-term rates, meaning banks have to pay a penalty rate for their deposits at their central bank. This results also in downward pressure on US yields, due to their relative attractiveness, and was accelerated by a flight to safety after the recent Brexit (see Chart 1).
Chart 1: 10-Year Yield for Government Debt of Major Economies (Year-to-date in %)
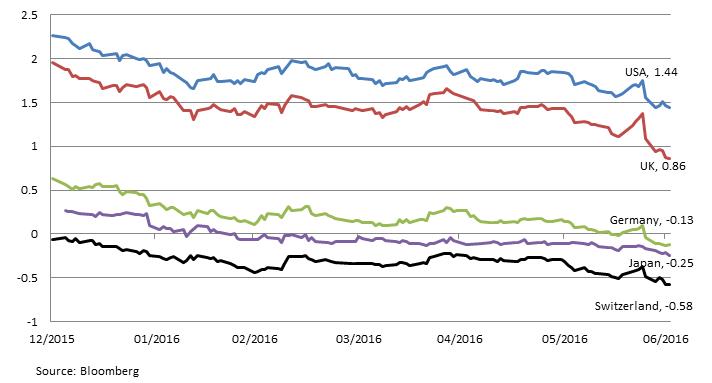
In this upside down world, savers ultimately have to pay the bank a storage fee for their deposits while borrowers will eventually get paid by the bank. However, there is a theoretical limit to this monetary policy tool. If central banks push interest rates even deeper into negative territory, at one point savers and investors will withdraw their cash and store it themselves, emptying banks and creating stress on the financial system.
Reason: Central banks across most developed countries try to stimulate and accelerate economic growth and revive inflation, which is far below their inflation targets. The underlying possible explanations however are more structural:
Demographics: Reduced workforce growth due to an aging population combined with slowing productivity growth results in lower economic output. In addition, an aging population, where baby boomers are preparing to retire, shifts towards increased savings and values safety more than potential profits.
Debt burdens: We are in a long-term debt cycle, which governments, households, and corporations accumulated over decades, and we are in the midst of the deleveraging process. Too much debt becomes deflationary for an economy, as funds are used for repayment instead of investment and consumption leading to lower demand, slower growth and lower interest rates.
Sentiment: The experimental and therefore unpredictable nature of monetary programs such as quantitative easing and negative interest rates results in uncertainty. Corporations become reluctant to invest and investors value the return of money more than a return on money.
Consequence: The topic of a no/low yielding bond market was omnipresent at the recent CFA Institute annual conference which we attended in Montreal, Canada. There was a sobering sentiment among a panel of large fixed-income investors. HSBC’s head of fixed-income research said that “trying to figure out the next central bank move to earn a few basis points does not make sense to him.” The director of global credit at DoubleLine reminded the audience that “credit quality does matter” as she sees a reach for yield in bond markets by taking unpaid risk. One speaker highlighted the unprecedented central bank experiment with his remark that “our models are not designed for negative interest rates.” According to the panelists, fiscal policies to fix the structural growth issue supported by debt forgiveness are needed to reverse the yield development.
What can we do to generate income? More of the same: Invest in dividend-paying companies with solid fundamentals and participate in sectors which are required to pay out most of their earnings, such as master limited partnerships. Take advantage of volatility in corporate bond market with opportunistic purchases and earn option premiums through structured products. Meanwhile we have to be disciplined not to overreach for yield and be compensated fairly for the risks – credit risk and the overall duration in your portfolios. A reversal of yields is difficult to foresee at this moment, however trend changes usually come when they are least expected.
Long-Term Perspectives
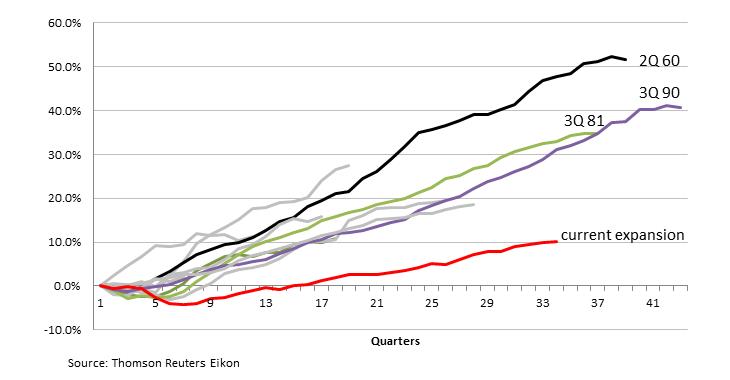
With Brexit becoming a reality and the increasing fear of a coming recession, it is prudent that we analyze the current expansion cycle and the possibility of a recession. We are currently at the 84th month of this expansion cycle and this is the fourth longest expansion in over 100 years. However, the Great Recession in 2008 was a more severe one than most recessions in the past. It is the longest one, had the second highest unemployment rate at one point and produced the largest decline in GDP since 1950 (See Table 1). The recovery after that was a slow grinding process that was more protracted than prior recoveries (See red line on Chart 2). It took 14 quarters to get back to the prior GDP peak and the annualized growth rate is 1.2% which is mediocre compared to an average of 3.1% of all expansion cycles. If history is any indication, this current expansion does not seem to have run ahead of itself and there are not many signs of overheating in the economy as well.
Table 1 – Past US Recessions
| Period |
Duration (months) |
Peak unemployment |
GDP decline (peak to trough) |
| Recession of 1953 |
10 |
6.1% (Sep 1954) |
−2.6% |
| Recession of 1958 |
8 |
7.5% (July 1958) |
−3.7% |
| Recession of 1960–61 |
10 |
7.1% (May 1961) |
−1.6% |
| Recession of 1969–70 |
11 |
6.1% (Dec 1970) |
−0.6% |
| 1973–75 recession |
16 |
9% (May 1975) |
−3.2% |
| 1980 recession |
6 |
7.8% (July 1980) |
−2.2% |
| Early 1980s recession |
16 |
10.8% (Nov 1982) |
−2.7% |
| Early 1990s recession |
8 |
7.8% (June 1992) |
−1.4% |
| Early 2000s recession |
8 |
6.3% (June 2003) |
−0.3% |
| Great Recession |
18 |
10% (Oct 2009) |
−4.3% |
Source: National Bureau of Economic Research
Chart 2 – Cumulative Real GDP Growth since Prior Peak
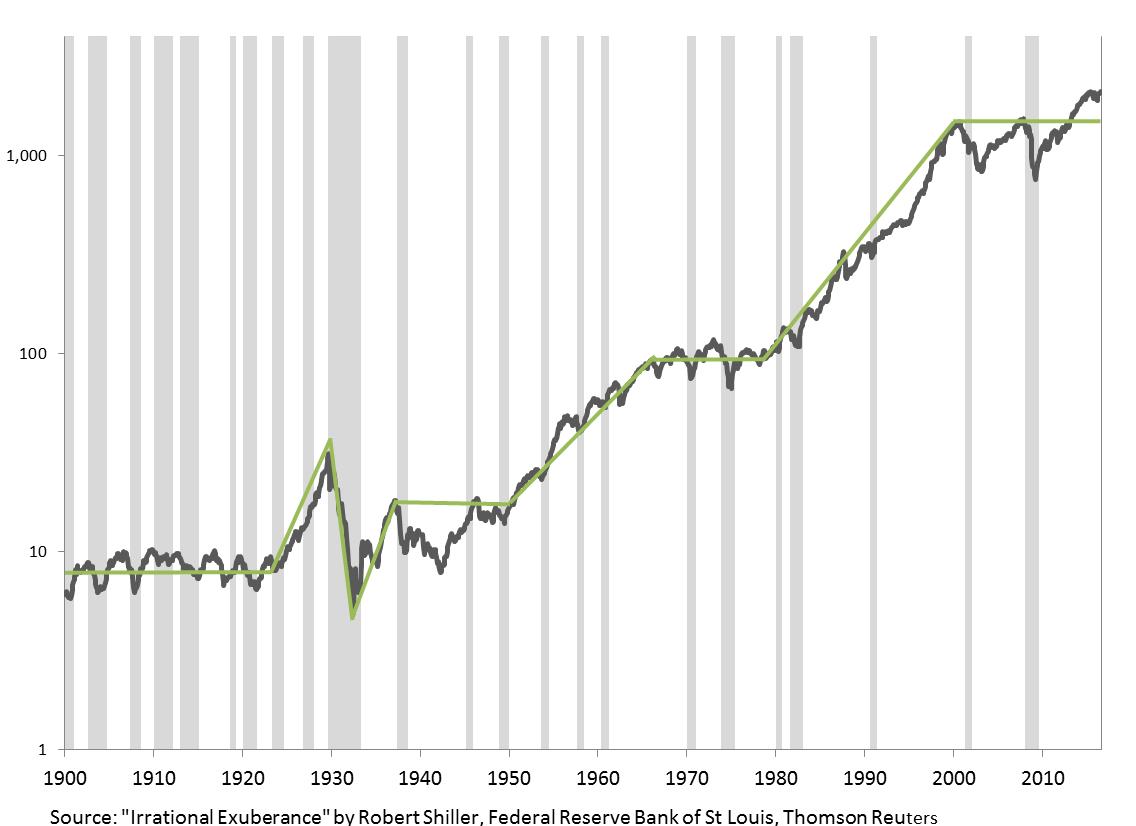
From a longer term perspective, using US stock markets as an example, equity market at times takes pauses to absorb abnormality before the next leg of growth (See Chart 3). Although we do not have a crystal ball, the current stage of volatility and swing in sideways may be just precedents of more stable growth in the future.
Chart 3 – US Stock Market since 1900 (S&P 500)
At this uncertain time, our investment philosophy is even more important as we remain focus on our companies’ fundamentals and long-term prospects. Market turmoil will work in our favor when we take advantage of short-term volatility to reposition and rebalance your portfolio. Please do not hesitate to contact us if you have any questions or concerns.
Sincerely,
Research Team
Form ADV is available upon request