Dear Client:
2016 Review
From the vote in the United Kingdom to exit the European Union, to the Chicago Cubs’ first World Series win in 108 years, to the results of the U.S. presidential election, 2016 has been a year of surprises. Perhaps the biggest surprise, especially in light of the correction that occurred in February which saw large-cap indexes down 10% and small-cap indices down 16%, is that the broad U.S. stock averages finished the year with double-digit returns. Based on price decline (excluding dividends) the S&P 500 Index had a negative return as late as June 28th. The strong performance came during the latter part of the year, with the index rising 7.4% from the opening bell on November 4th, the last Friday before the election, through year-end. The fear of global recessionary pressure that prevailed during the early months of 2016, and the rush to buy sovereign bonds following the British referendum held in June, abated as domestic economic indicators improved. Earnings comparisons, for the September calendar quarter, were higher than the year-earlier period for the first time since June 2015. In addition, GDP grew at an annualized rate of 3.3% during the September quarter, surpassing expectations.
The political pollsters misjudged the outcome of the American presidential and senatorial races. Following overnight swings in stock futures prices, the market opened with a strong rally which was sustained until peaking in mid-December. This positive sentiment is fostered by the hope/expectation that lower taxes, increased government spending, and reduced government regulation will lead to improved economic growth.
Market leadership flipped from high-yield, conservative utility and telecommunication stocks in the spring and summer months, to cyclical and financial stocks during the latter months. Energy and bank stocks were among the biggest decliners during the February correction as each sector fell 14%. The concerns then were that numerous smaller energy companies would file for bankruptcy creating another round of write-offs for the lending industry. As oil prices stabilized at higher levels, the exploration & production contractors and the oil service companies were able to survive the potential crisis. The energy sector, as measured by XLE, rebounded to finish the year with a price rise of almost 25%. The financials, as measured by XLF, rose 22.3% for the year, with much of that coming from a 16% gain during the final quarter. Likewise, aerospace & defense contractors registered the majority of their 17% calendar gain following the election. Healthcare was the lone sector to post a negative return with the XLV declining 4.5% (without dividends). The biotechnology industry was particularly weak, following a multiyear run of strong performance, with the IBB falling 21.5%. The Russell 2000 Small-Cap Index followed a similar script as the energy sector this year, with a large decline in February followed by strong performance after the summer and into year-end. Smaller energy companies are well-represented in the Russell index, although it is worth noting that many have marginal balance sheets and do not meet our requirement of strong fundamentals and sound financial condition.
U.S. Outlook
How much regulatory relief, repatriation and economic growth the Trump administration and Republican Congress can deliver remains to be seen. It would appear a fair amount of optimism is already discounted in the market with the S&P trading at 19 times 2016 estimated operating earnings of $118 per share. It is perhaps ironic that one year ago, the estimates for 2016 were $118 per share, then the estimates were slashed to approximately $110 during the market correction, and have now worked their way back up throughout the year to their former level. For reference, analyst estimates for 2017 operating earnings per share are $128.23, yielding an earnings gain of 8.6%. This seems to be a reasonable outlook given that energy companies will revert back to positive earnings comparisons this year.
Some strategists expect the S&P will end 2017 in the vicinity of 2,500, or 19.5 times estimated earnings, versus 2,239 at year end 2016. We observe that commodity prices appear to have bottomed last spring and are slowly rising. In addition, the labor market for skilled workers has tightened. In the absence of quickening inflation and accelerated Fed interest rate increases, we too would expect the stock market to rise marginally. If the U.S. Dollar remains strong, the Fed will likely take a slow approach to increasing interest rates. Given the rally that some industries have enjoyed over the past 2 months, we expect to encounter some consolidation and profit-taking over the coming quarter in the new year.
Euro-zone
The Euro-zone continued its slow economic expansion, growing real GDP around 1.7% in 2016. However, looking past the aggregate level, you can see varied speeds: Spain managed a nice recovery (real GDP growth above 3%) and Germany slightly accelerated its growth to 1.8% with a tight labor market, while Italy stagnated at low levels (below 1%) and France’s economy even decelerated throughout 2016. The European Central Bank (ECB) expects a continuation of the moderate but firming recovery of the euro area economy with 1.7% real GDP growth in 2017.
The concern of deflation is abating, as inflation stabilized around 0.9% in 2016 with expectation of further increase this year. Still, it remains below the ECB’s target and thus the asset purchase program was extended recently by another nine months to the end of 2017, albeit at a reduced monthly purchase volume. This means continued headache for Europe’s fixed income investors with low or negative interest rates.
The political risk is heightened as several national elections will be held: The Netherlands and France in the spring, Germany in the fall of 2017. Criminal and terrorist acts committed by refugees are strengthening populist movements in these countries and could lead to unexpected voting outcomes. In addition, the consequences of Britain’s exit from the European Union (Brexit) remain unclear and Greek’s unsustainable debt situation remains unresolved. Each of these events has potential for market volatility.
Valuation of the European equity market on an aggregate level is around its long-term average, certainly fair for these moderate and slightly strengthening fundamentals. We think diversification outside the US market is prudent and believe the Euro-zone could be one of the potential candidates.
Emerging Asia
After decades on the supply side of global trades, emerging Asia countries are confronting the challenges of decelerating growth and increasing capital outflow due to a strong U.S. Dollar. In general, a weaker currency is favorable for exports since it boosts competitiveness by lowering prices in Dollar term. However, an economy heavily relying on pricing strategy tends to delay industrial upgrades and transformational investment which eventually lead to falling productivity growth. Economic stagnation could occur if the population is aging rapidly as in Japan. Taiwan seems to follow the same pattern if its government does not act immediately. South Korea is able to break away from this stereotype by supporting large corporations to develop global brands and stay away from pricing only strategies.
China’s growth is decelerating and the country needs to rebalance its source of growth – from infrastructure investment to consumption demand. Fortunately, China has a large middle-class striving for a better life and a stable political system competent of implementing its plans. This is not to say there is no concern about China; for instance, the ballooned credit and industrial overcapacity continue to be a drag on growth. Southeast Asian countries become the world’s new factory hub thanks to China’s labor cost inflation. Nevertheless, many of them remain labeled as high-risk markets due to political instability.
Still, there remain attractive opportunities in the consumer and service industries in the region. As the middle-class becomes more affluent, the service industry in turn becomes the command force in the economy. Since 2015, the service industry has contributed more than 50% of the GDP in the region.
East Asia & Pacific (excludes high-income economies)

Fixed Income
Interest rates across developed markets reversed their long decline at the year-end, led by a rally of rates in the U.S. (see chart below). Increases in actual U.S. inflation throughout 2016, driven mainly by recovering energy prices, made a trend reversal in rates more likely. However, the real catalyst came from growth optimism and reflation expectations under a Trump administration. Many of Mr. Trump’s policy plans point to higher future inflation: More fiscal spending and government debt issuance due to infrastructure investments; higher wages due to reduced immigration; and higher import prices due to a more restrictive trade policy. The actual execution of these plans will determine the long-run sustainability of these rate levels.
10-year Yield for Government Debt of Developed Economies (year-to-date in %)
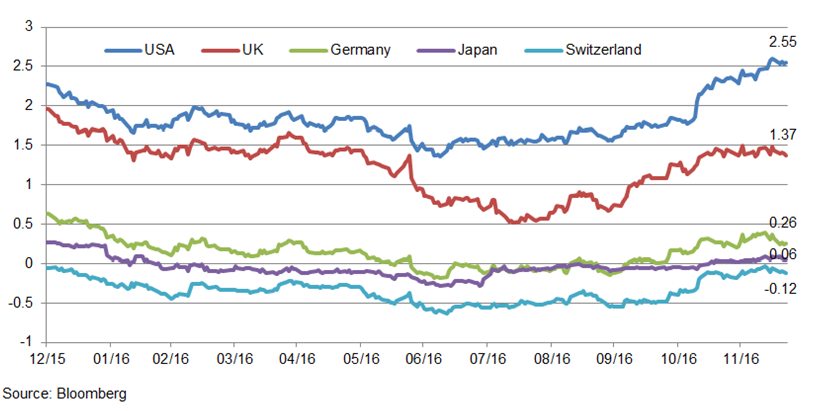
What does the Fed think? In the last meeting of 2016, its board increased short-term interest rates, the second time only in a decade! Although it made only small changes to its growth and inflation outlook, the economic conditions gave it sufficient confidence to expect three more rate hikes in 2017.
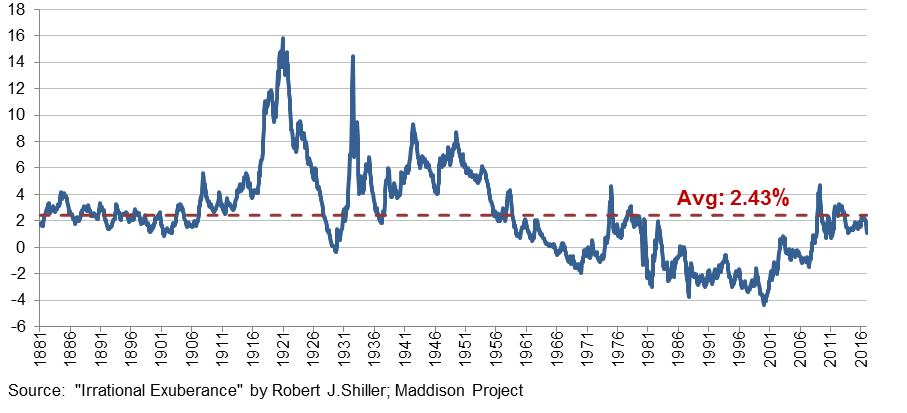
The outlook for higher short-term and long-term rates makes investment in fixed income more attractive. Tempering our interest is the fair valuation, as spreads (over treasuries) for investment-grade and high-yield corporate bonds tightened below long-term averages during the year. The yield difference between earnings from equities and the 10-year treasury shrunk to 1.1% which provides a value indicator of equity relative to fixed income (see chart below). Judging from long-term history, it is probably too early to suggest asset allocation shifts in your portfolios, but it is a development worth monitoring closely.
S&P 500 Earnings Yield minus 10-year Treasury Yield
Conclusion
2016 was a particularly trying year in some respects, and many have expressed their joy that it is behind us. We bid farewell to some of our heroes in 2016 including golfing great Arnold Palmer, icon Muhammad Ali and astronaut John Glenn. As we look ahead with hope and optimism to 2017, we welcome your thoughts and suggestions.
Sincerely,
Research Team
Form ADV is available upon request