Dear Client:
Ten Years After
While the heading may remind some of a popular British rock band, others will recall that September marked the 10th anniversary of the fall of Lehman Brothers when the global financial system came close to cessation in the early days of the financial crisis. The problem was fairly straightforward following a decline in housing prices and a rise in mortgage delinquencies. Many institutions had non-performing mortgage loans they had either made directly to borrowers or purchased as investments from the Federal National Mortgage Association, colloquially known as Fannie Mae. Because they were already highly leveraged, certain banks and other firms needed short-term funds to continue operating. As lenders cut off credit lines to faltering borrowers rendering them unable to meet their obligations, counter-party failures magnified losses throughout the banking system impairing the assets of previously healthy institutions. The U.S. banking system has endured similar circumstances during its history, including a painful episode in 1907 leading to the congressional charter and creation of The Federal Reserve System in 1913.
Learning from mistakes made during the Great Depression, the Federal Reserve (Fed) and the Bush administration moved quickly to gain emergency powers from Congress to address the crisis of pending failures which would have been catastrophic to the economy. Congress authorized in October 2008, up to $700 million of available funds through the Troubled Asset Relief Program (TARP) for banks, insurance company AIG, General Motors and Chrysler, and housing program disbursements, all administered through the Treasury Department. Likewise the Fed purchased over $3 trillion in U.S. Treasury debt and mortgage-backed agency bonds to provide liquidity to the housing market and financial system, allowing banks to carry out normal credit functions. Of $440.2 billion TARP funds actually disbursed, the Treasury had collected $442.6 billion by June 2015, recouping all taxpayer funds even beyond $28.5 billion of housing assistance grants.
The financial crisis was a global phenomenon as property prices dropped and consumer debt was extended, and banking capital ratios were low in many countries in addition to the U.S. What was unprecedented in this recovery was the coordinated effort among global central banks to lower interest rates and also purchase sovereign debt (quantitative easing) to successfully stave off a deeper recession or likely, a depression. Since the end of 2008, nine of the world’s ten largest economies were able to generate economic growth (see table 1), albeit below historical norms, during a difficult period of consumer deleverage and bank recapitalization.
Table 1 – Gross Domestic Product (GDP) Growth (2009-2017 annualized %; Countries ranked by GDP size)
| United States | 1.59% |
| China | 8.10% |
| Japan | 0.70% |
| Germany | 1.18% |
| United Kingdom | 1.27% |
| India | 7.38% |
| France | 0.75% |
| Brazil | 1.15% |
| Italy | -0.51% |
| Canada | 1.74% |
The World in 2018
Using Fed Chair Jerome Powell’s words, the US economy appears to be in the midst of a “remarkably positive” period. Growth of GDP is expected to be around 3% for 2018 approaching its long-term historical average. Unemployment stays at a very low level of below 4%, last time seen in the year 2000 and before that in the late 1960s. This is paired with tame inflation of around 2% which is in-line with the Fed’s objective as well as its outlook over the medium term. Potential upside pressure to inflation could come from wage growth, it accelerated from 2% to 3% over the past three years, albeit at a measured pace. A second source could be higher import prices resulting from trade tariffs. Asked about it at the September Fed meeting, Mr. Powell replied that they do not see signs from tariffs yet, for example in the form of price increases at retailers, and that the aggregate impact of all announced tariffs would still be small to the US economy. All enacted tariffs amount to 0.3% of US consumer spending, and adding the proposed tariffs would raise it to 0.7%, a still manageable size. This includes, among others, tariffs on Chinese goods, European autos, as well as steel and aluminum.
In view of the labor market conditions and inflation, the Fed remains on its path of gradual short-term rate increases. The eagerly awaited normalization of interest rates continues. Shown in chart 1, the Fed expects one more rate hike (plus 0.25%) this year and three additional increases (plus 0.75%) during 2019. This would raise the federal funds rate above 3%, a level somewhat above current market expectations as indicated by Fed funds futures. For medium-term (5 year) and long-term (10 year) rates the market, indicated by forward interest rate swaps, expects only small increases as long-term inflation expectations remain low. Additionally, you can argue that US long-term rates continue to be downwardly pressured from excess liquidity of the European Central Bank (ECB) and the Bank of Japan (BoJ), which steers investors from these regions to the higher yielding US fixed income market. However, in the case of the ECB, excess liquidity in the form of asset purchases will end soon as it intends to halt its quantitative-easing program in December this year.
Chart 1 – Fed Funds Past & Future
Source: Federal Reserve, Bloomberg
Equity and Fixed Income Markets
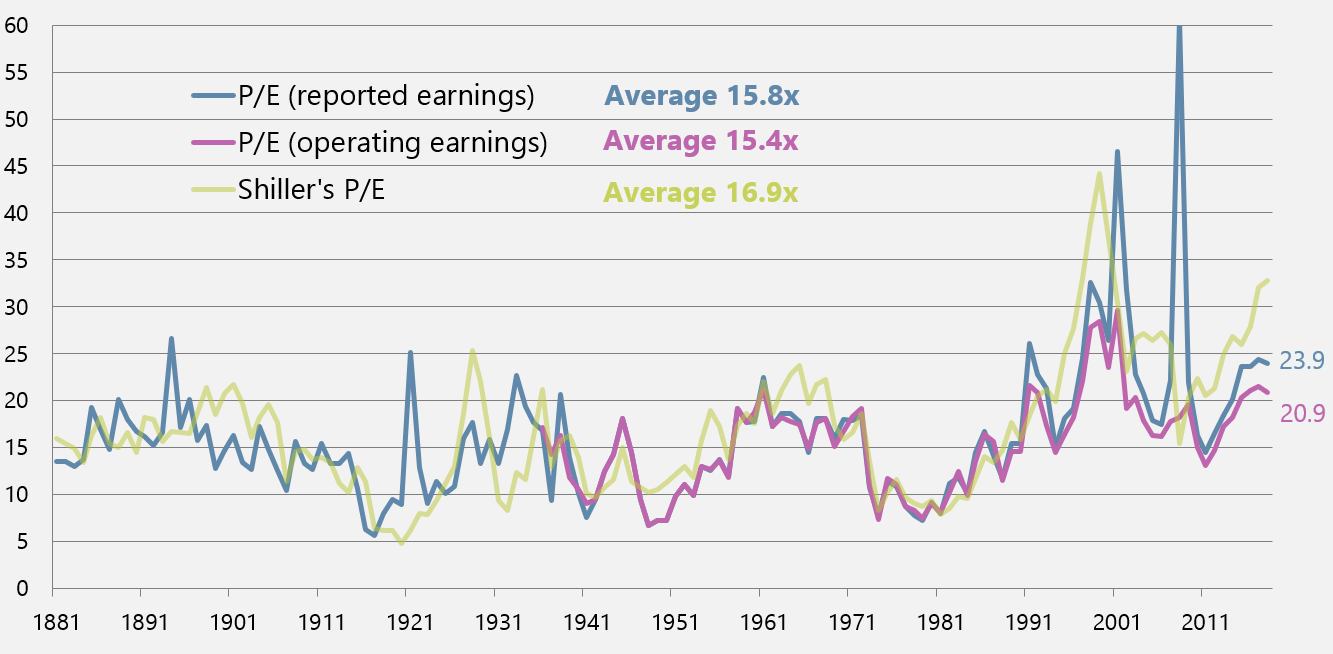
In this environment of rising rates, it is worthwhile to revisit the relative value between equity and fixed income markets. Valuation of equities, represented by the S&P 500 Index, is somewhat lower compared to last year resulting from strong realized and expected earnings growth (see chart 2). For the full year of 2018 expectation is more than a 20% increase driven by revenue growth, margin expansion, and a reduced corporate tax rate. Importantly, the tax reform has contributed around one-third to earnings growth, confirming that the underlying growth excluding the one-time tax effect is also strong.
Chart 2 – US Equities Price/Earnings Ratio
Source: Standard & Poor’s and Robert J. Shiller of Yale University
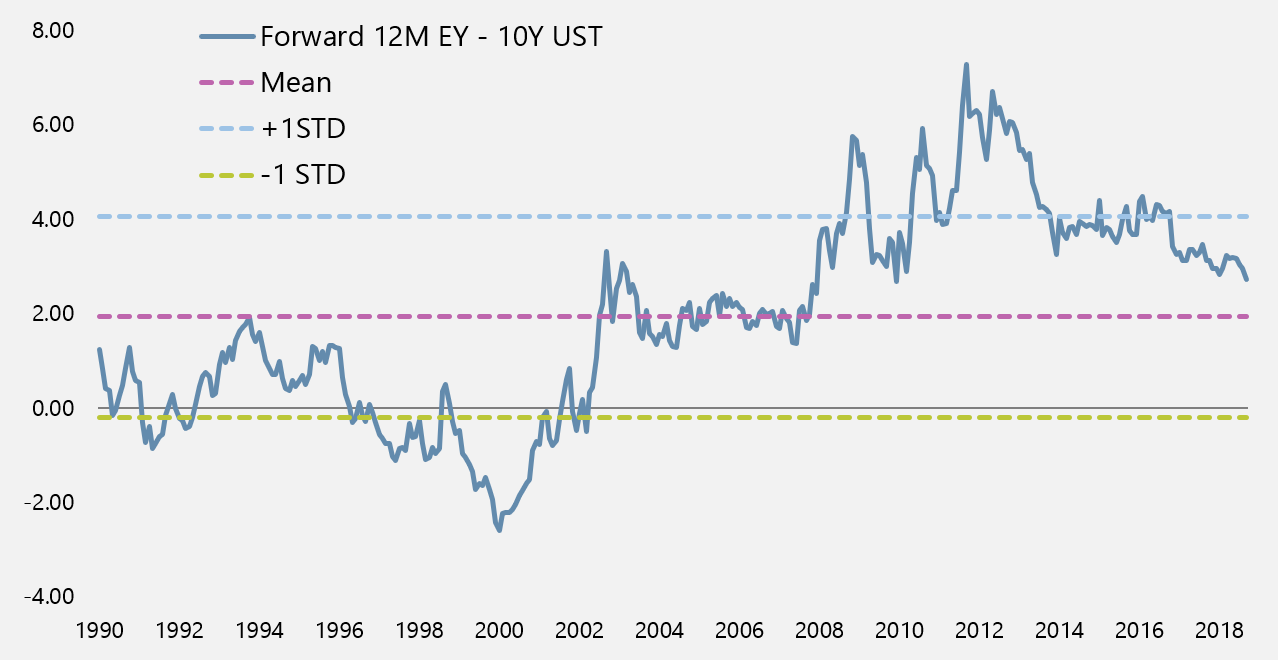
The yield difference between equity earnings and the 10-year treasury shows a somewhat reduced, but still attractive equity premium compared to its long-term average (see chart 3). It does not signal a drastic change in the asset allocation of portfolios towards fixed income, however marginal shifts are prudent in light of an upward interest rate trend and elevated equity valuations.
Chart 3 – S&P 500 Forward Earnings Yield – 10-year Treasury Yield (nominal)
Source: Bloomberg
In an environment of healthy economic growth, accessible credit markets and a slowly tightening central bank, interest rate risk, and not credit risk becomes the larger enemy to bond portfolios. We have purchased variable-rate (fix-to-float) or floating-rate perpetual bonds over the past few years in order to reduce the exposure to interest rate risk. After recent rate increases we also started to add short-duration corporate bonds thereby positioning ourselves to the front-end of the yield curve and again limiting interest risk. In addition, we continue to look for opportunities in single-name reverse convertible notes, however decisions there are driven foremost by the (implied) volatility level and our fundamental outlook of a company’s stock and not by interest rate movements. Lastly, we should not ignore the value of cash anymore, at least for shorter-term periods. It earns around 2%, has zero duration, is a floating instrument which adjusts almost immediately, and also allows you to take advantage of volatility.
Outlook
The markets are not without risks. We have recently witnessed a drop in existing home sales and in auto sales, two sectors that have recovered strongly in the past decade. Consumer spending and consumer debt have grown since the crisis, although not to excessive levels. We feel the economic momentum will continue well into 2019 as there are no precursors indicating a recession as of yet. Equity valuations are at the higher end of the historical range, supported by strong cash flow and benign inflation. Against that backdrop of solid fundamentals and multi-year time horizon, we remain invested in select equities recognizing the potential for near-term volatility from interest rate spikes and political news centered around upcoming elections.
As always, we appreciate your business and please tell your friends about us!
Sincerely yours,
Research Team
Form ADV is available upon request


